BEVEL · The point of it
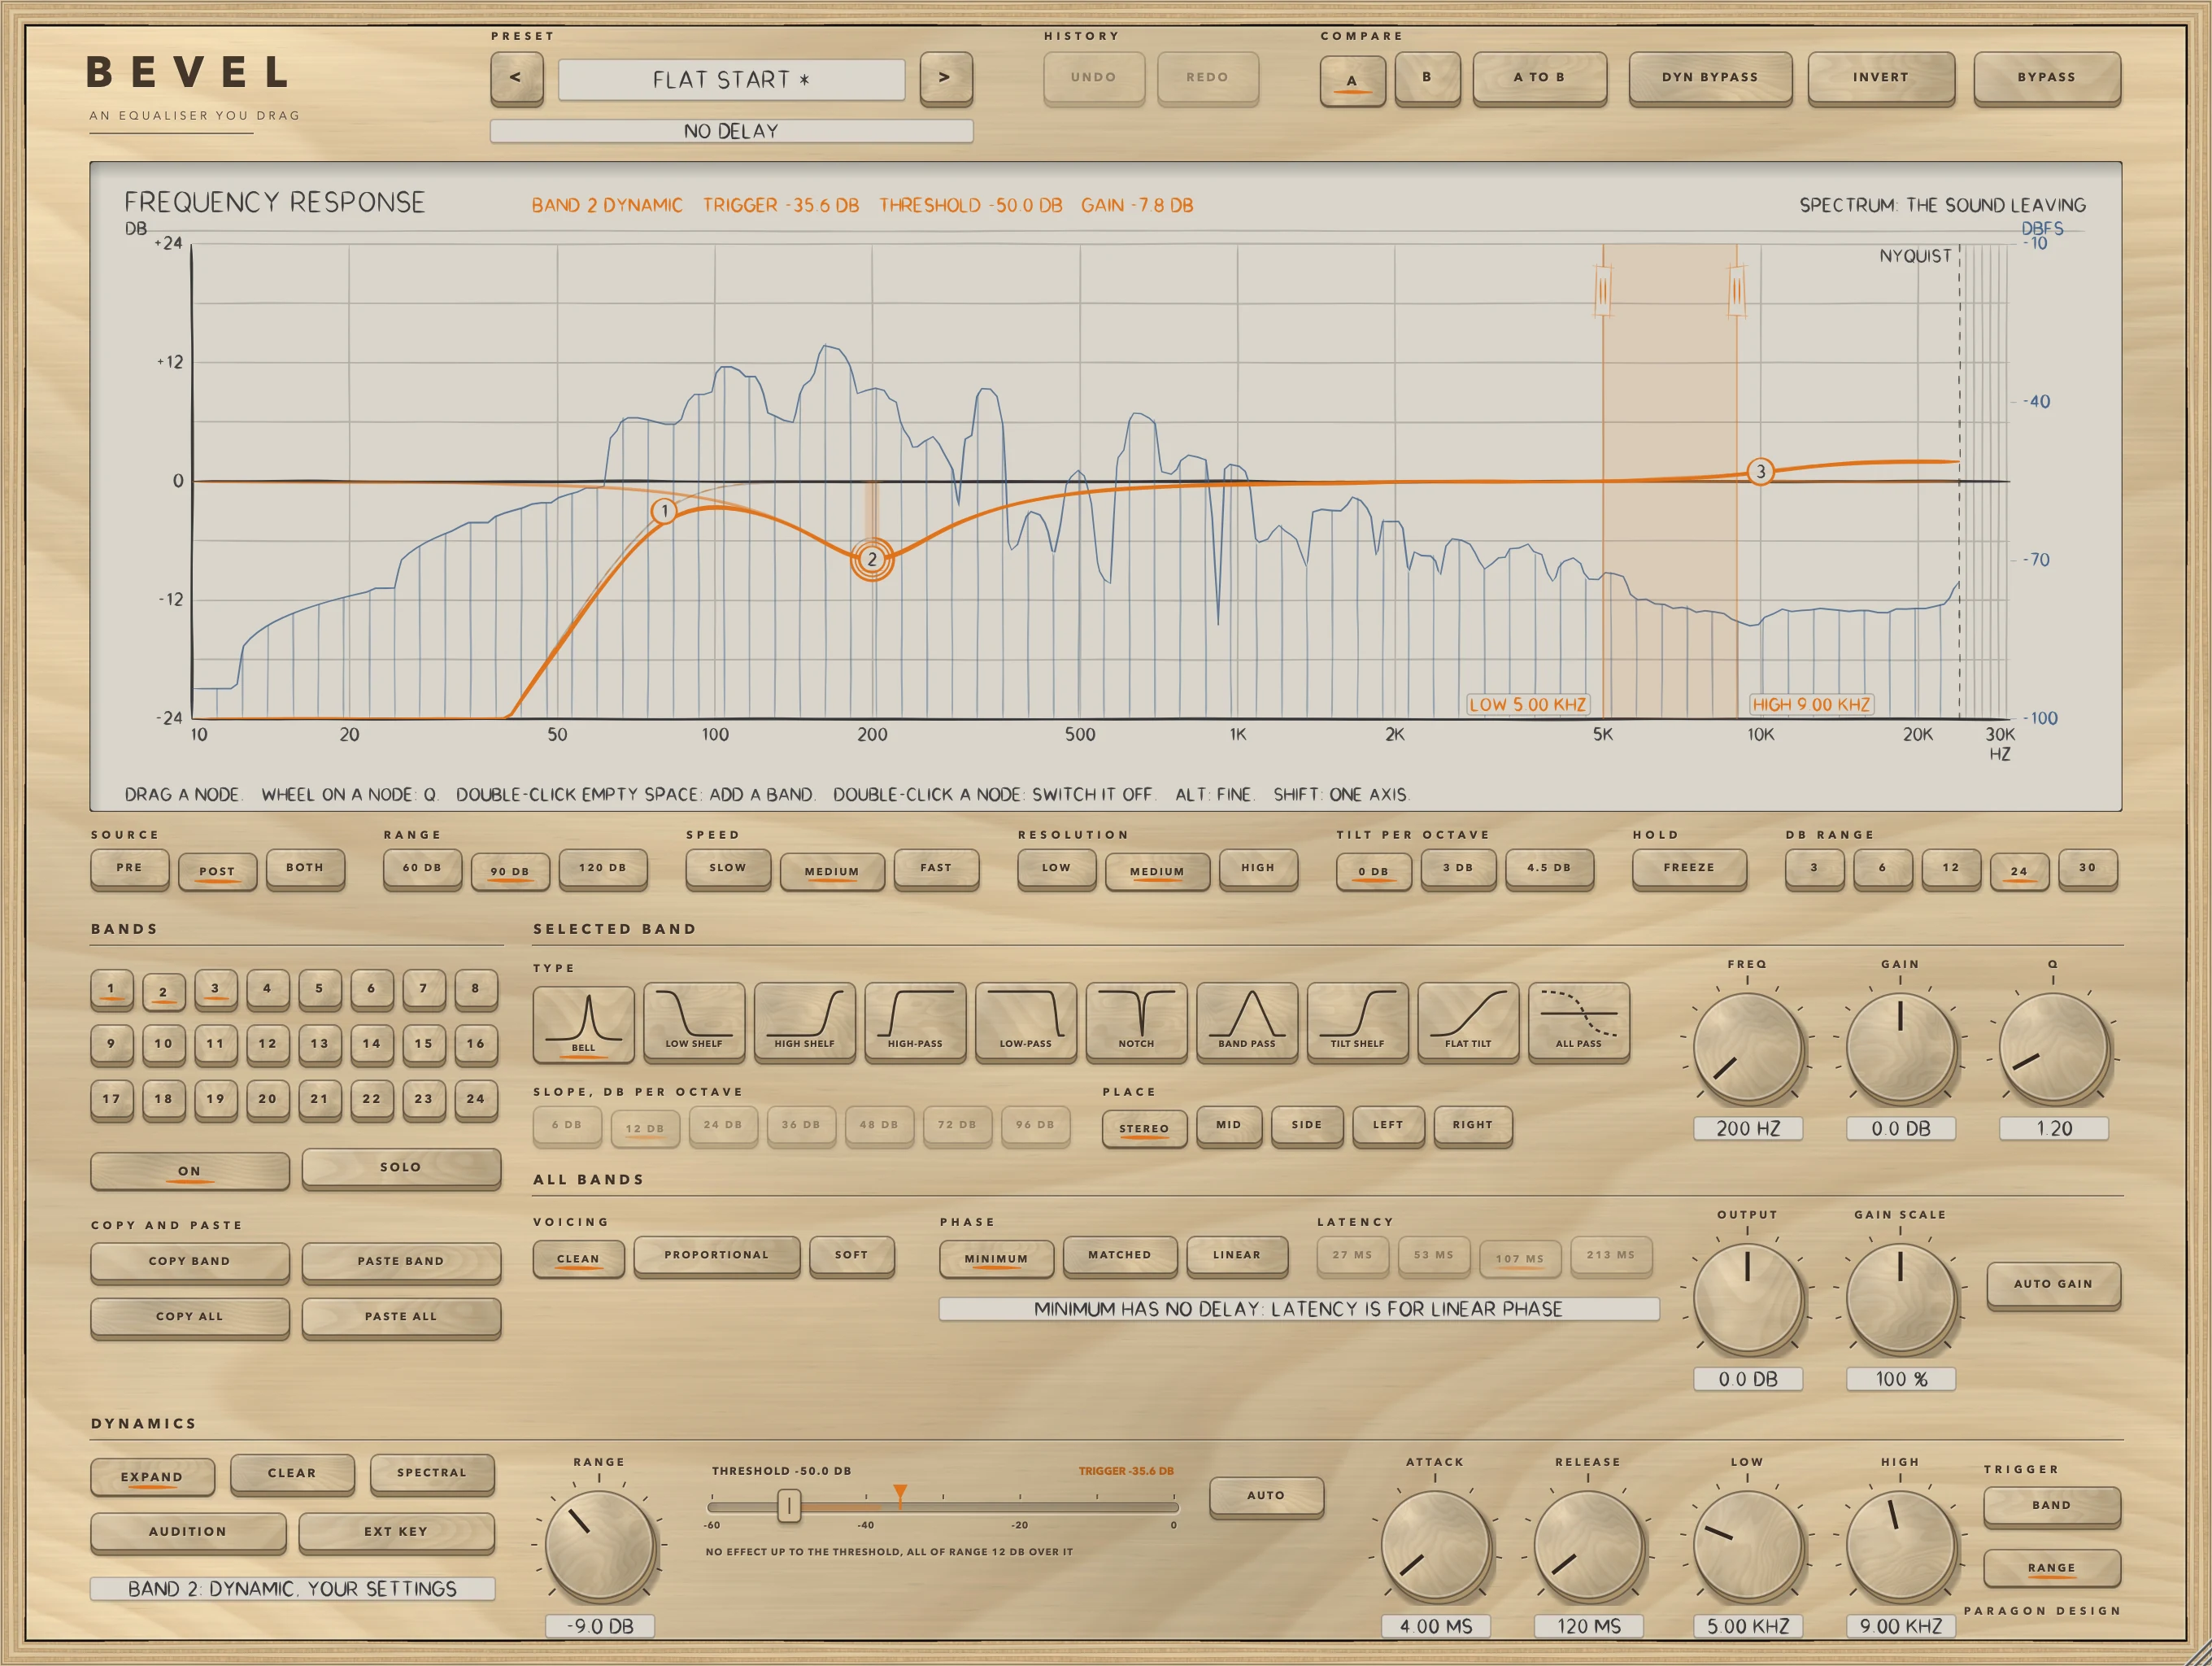
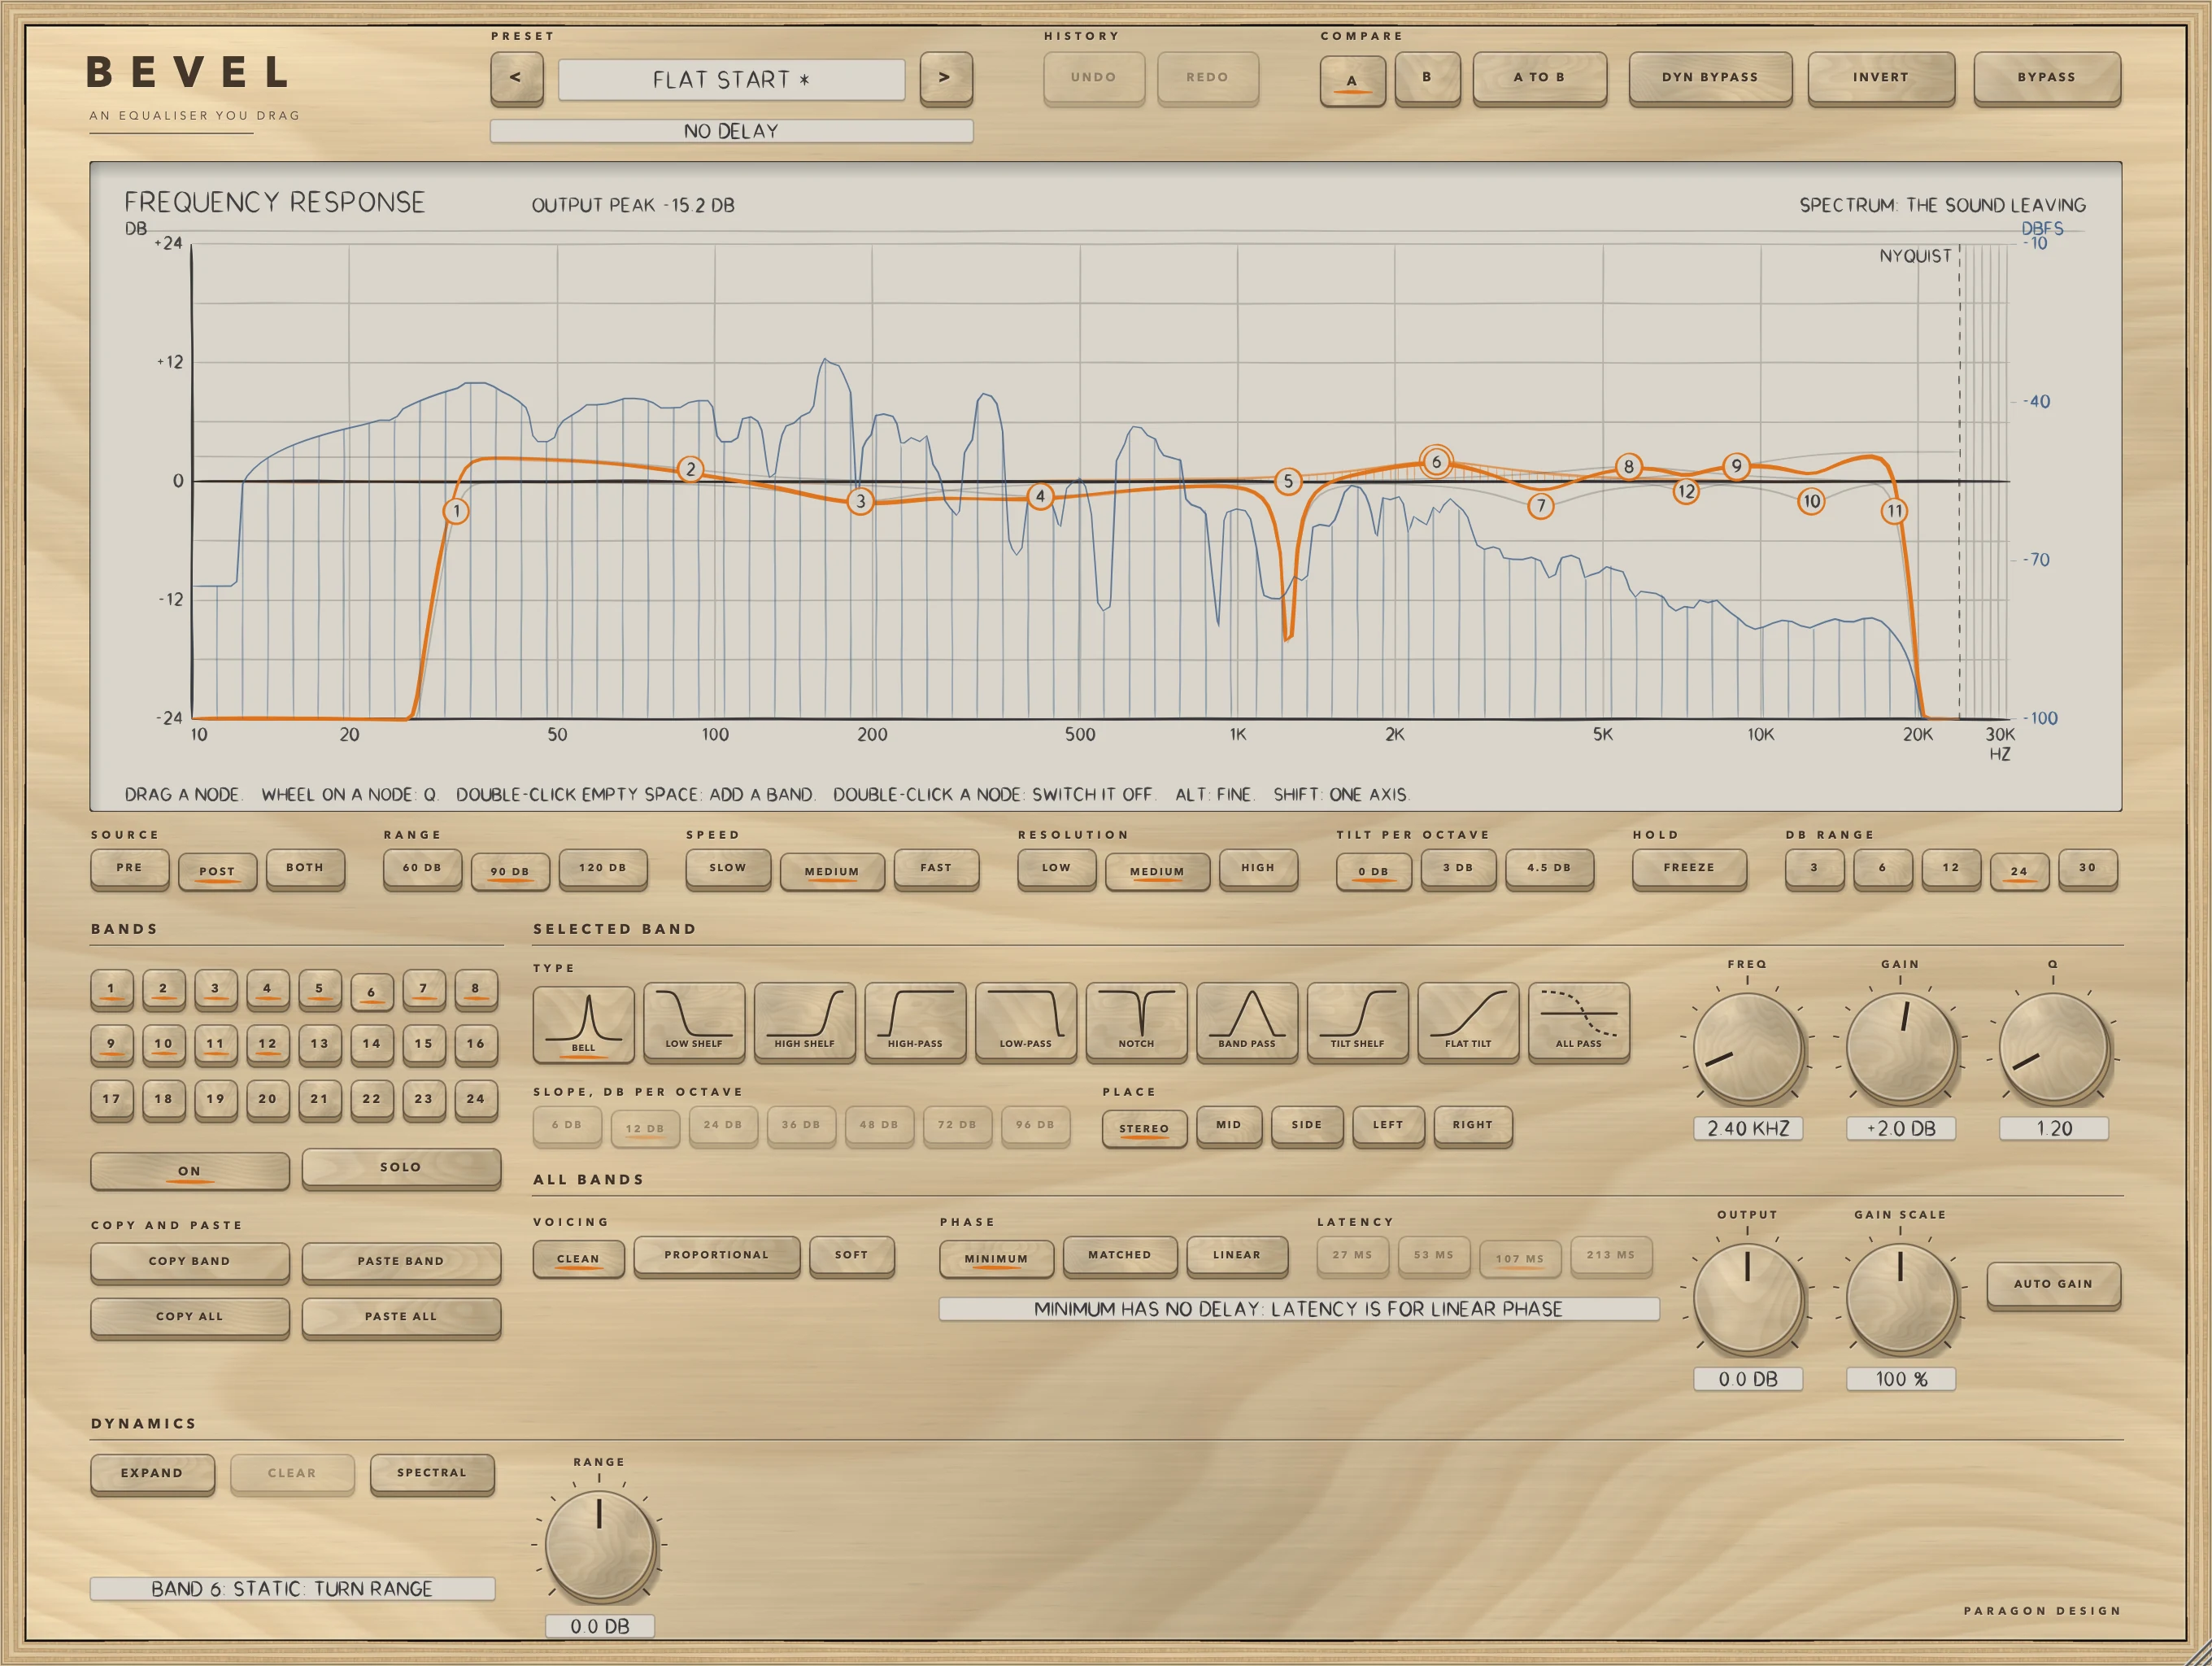
The curve you drag is the curve it runs.
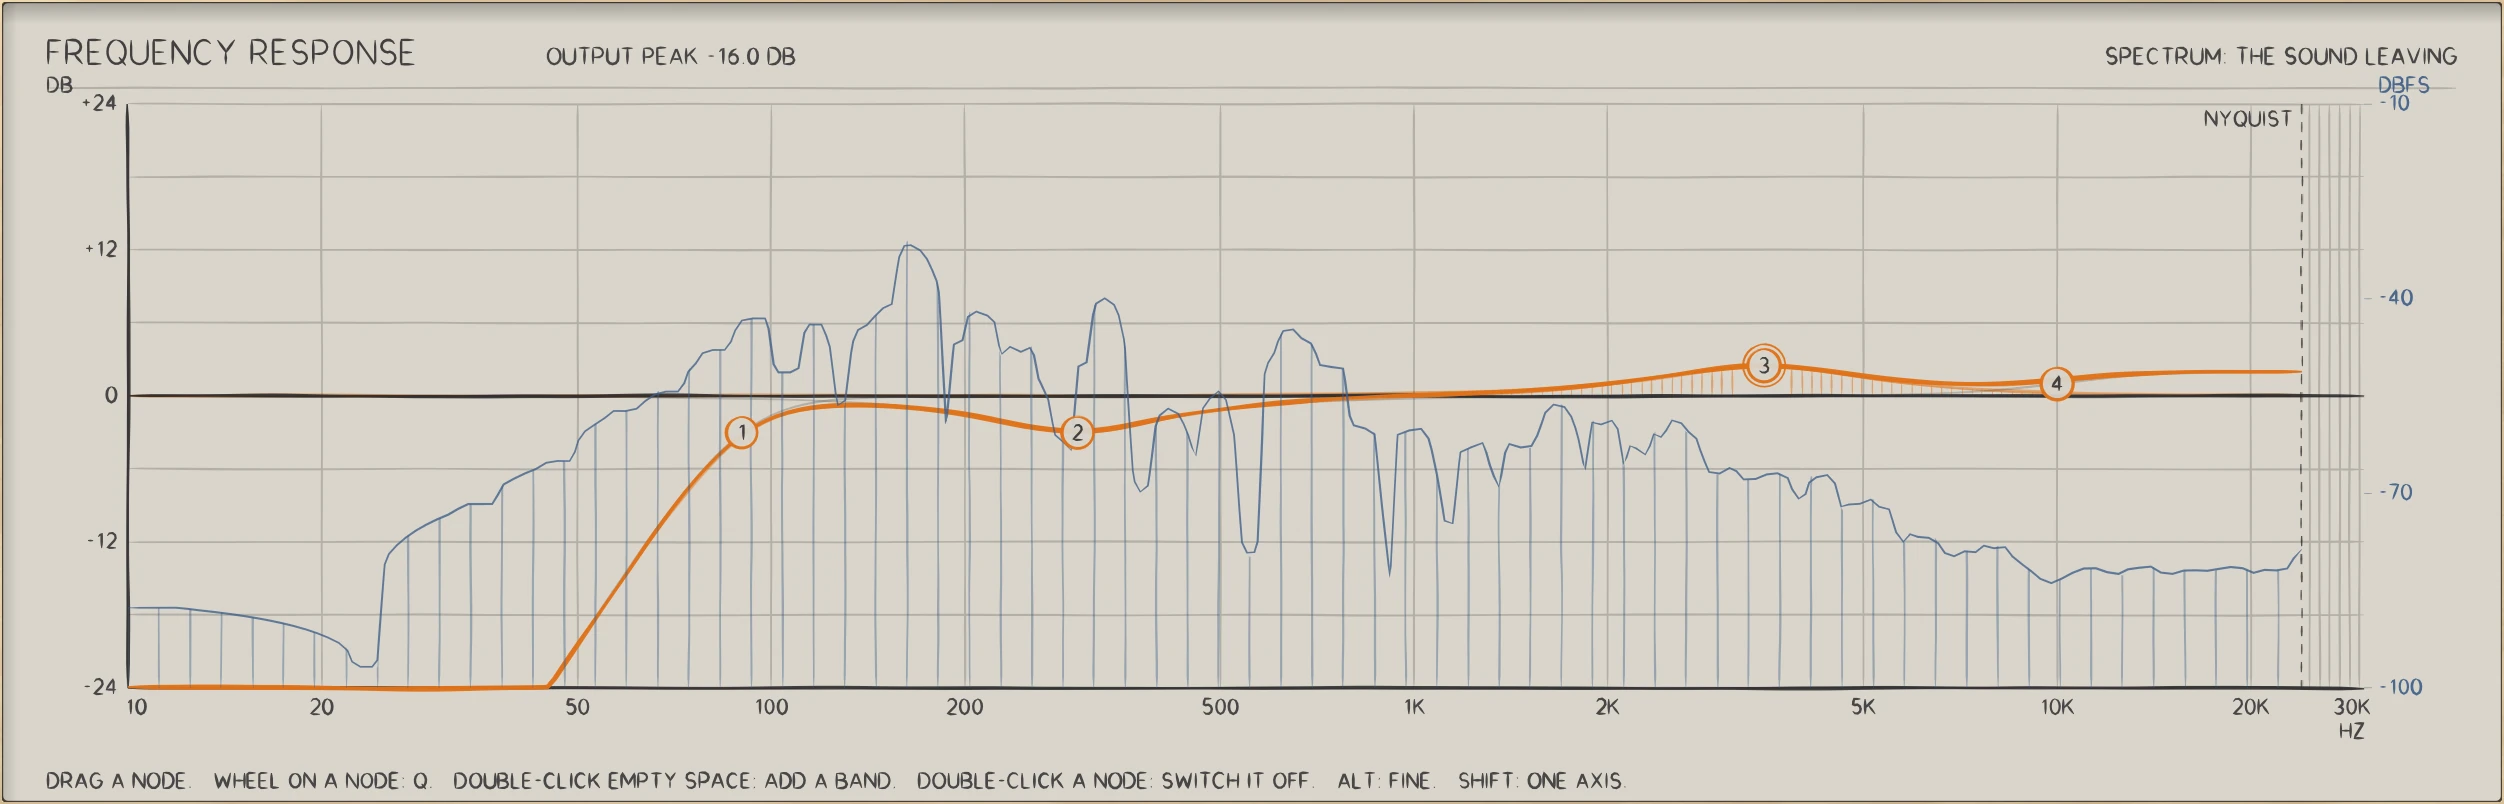
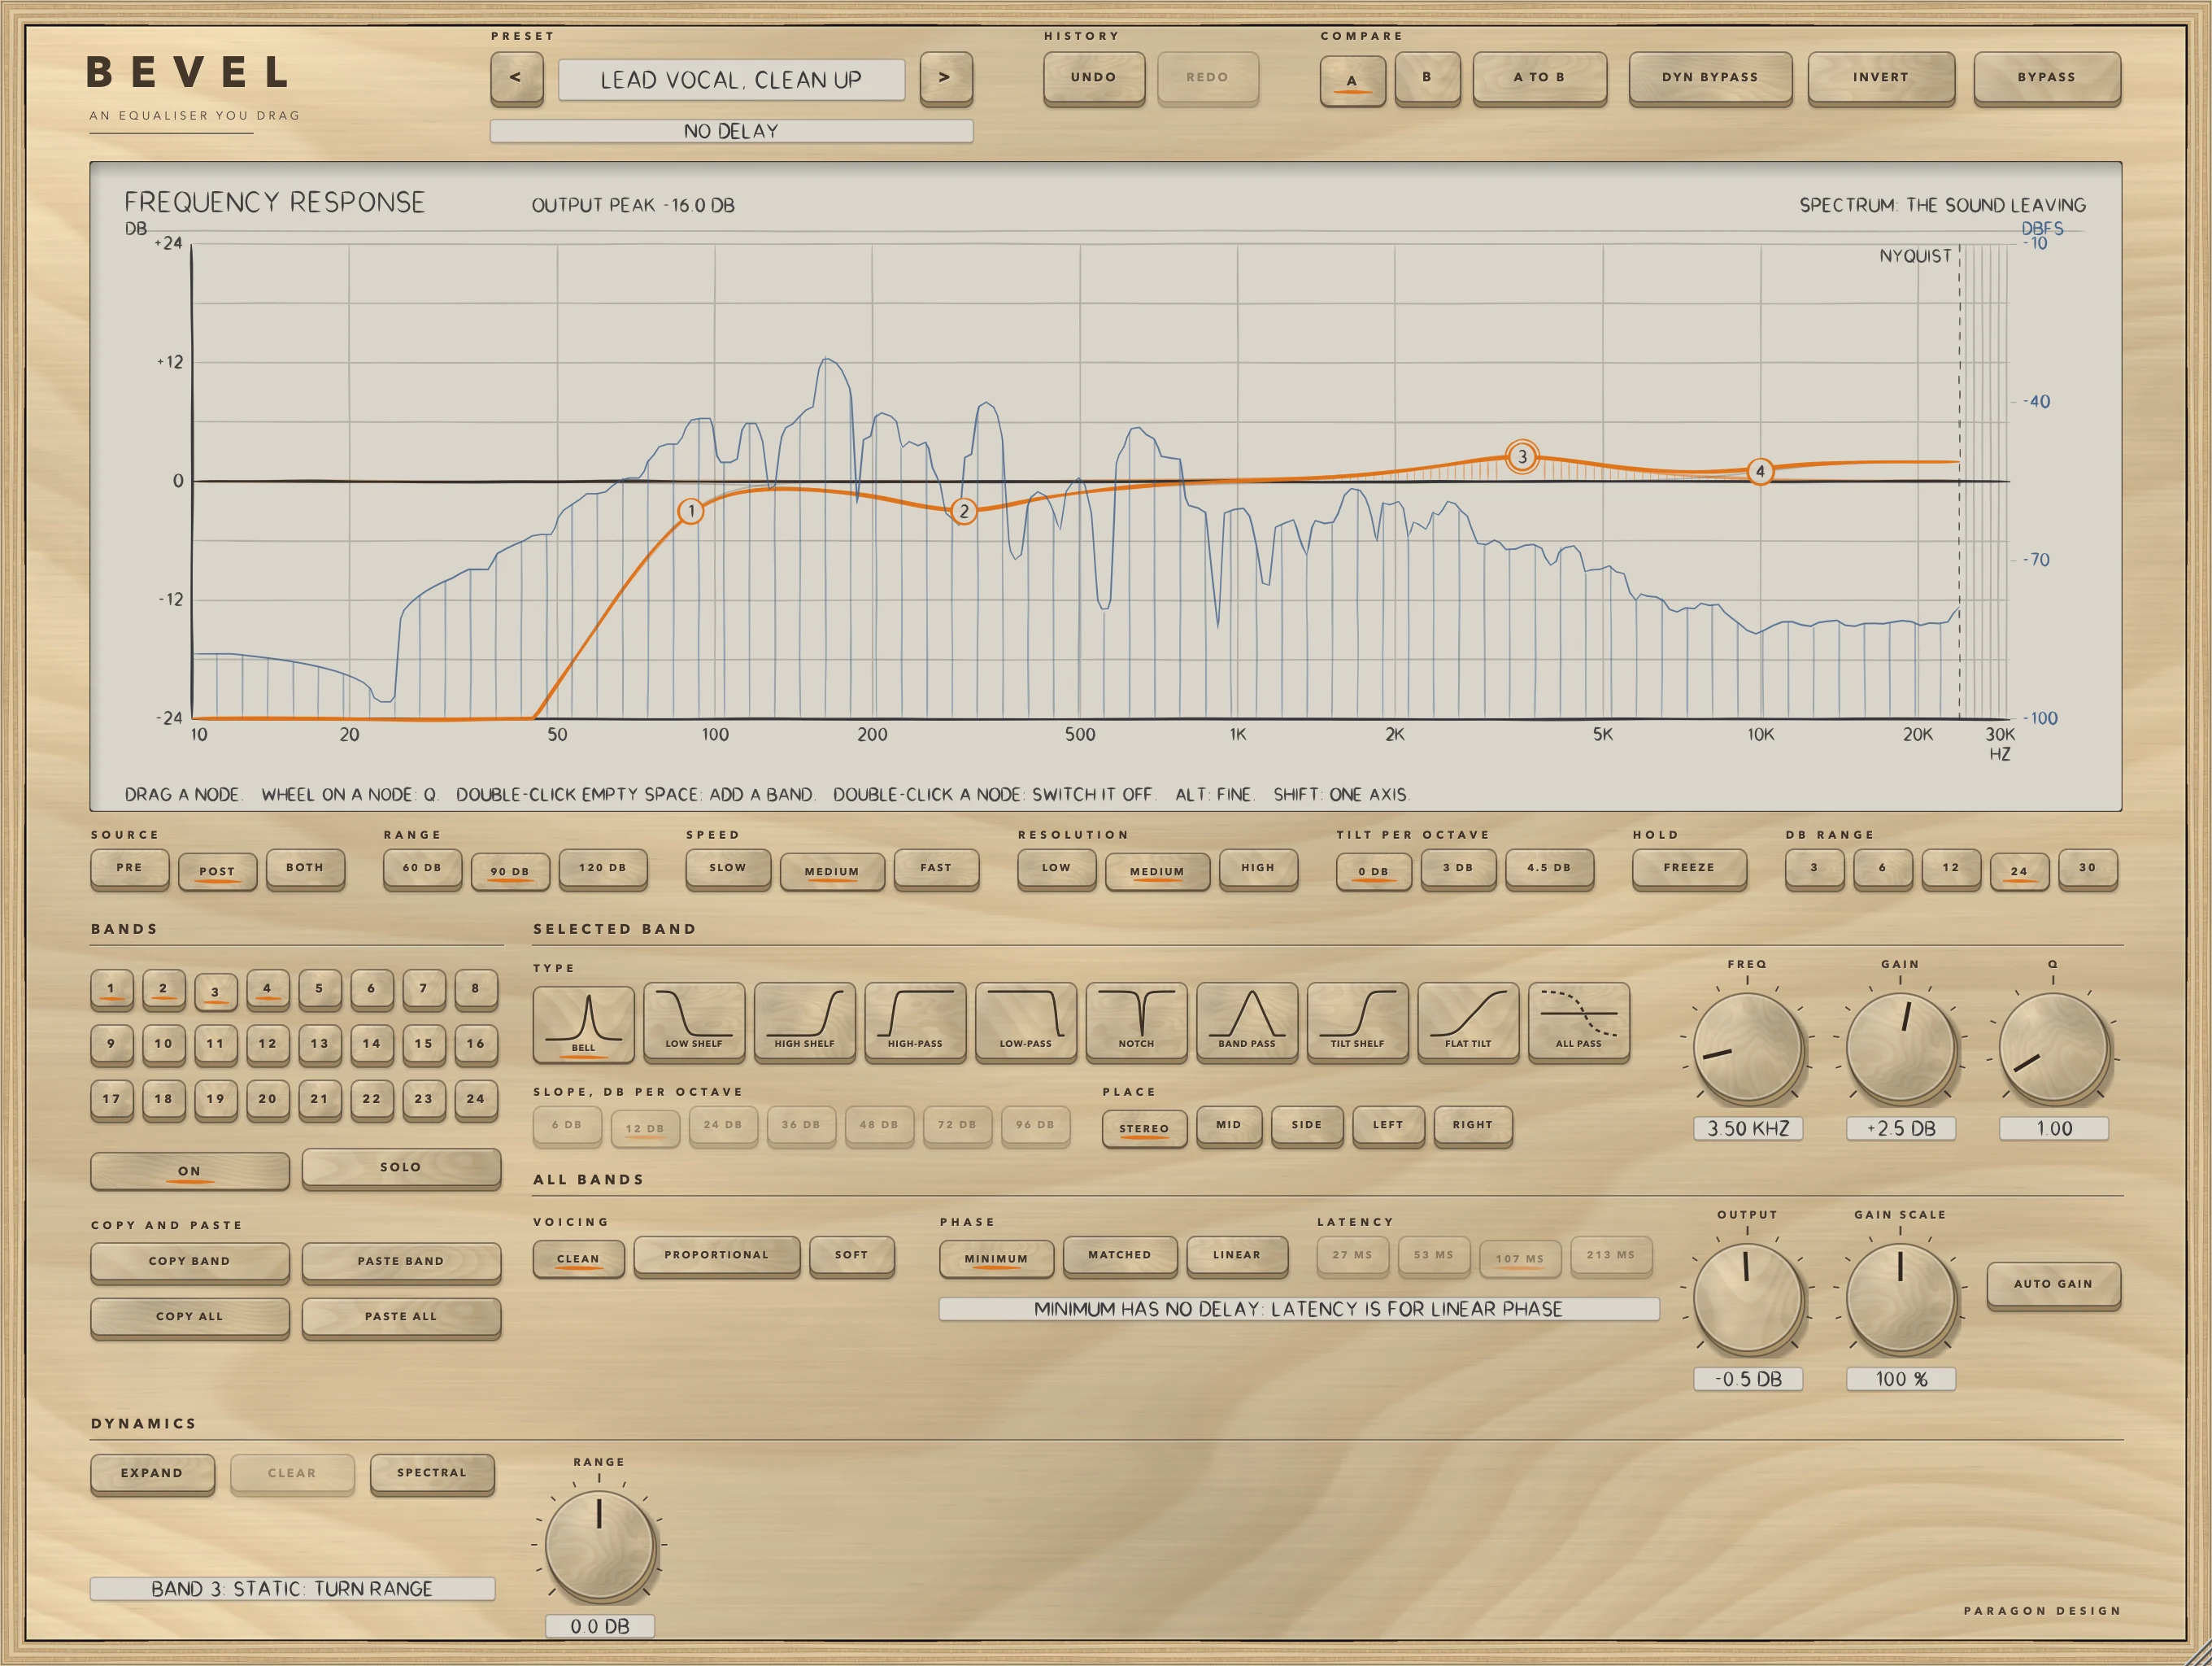
The display draws each band's response from the same numbers the filters run, with the spectrum of the sound moving underneath it. The engine's own response, read back from an impulse, agrees with that curve within 0.05 dB, the limit the test sets, at every point from 20 Hz up to 0.45 of the sample rate where the curve is above -80 dB, at 44.1, 48, 96 and 192 kHz, for every shape. The worst difference was 0.014 dB.
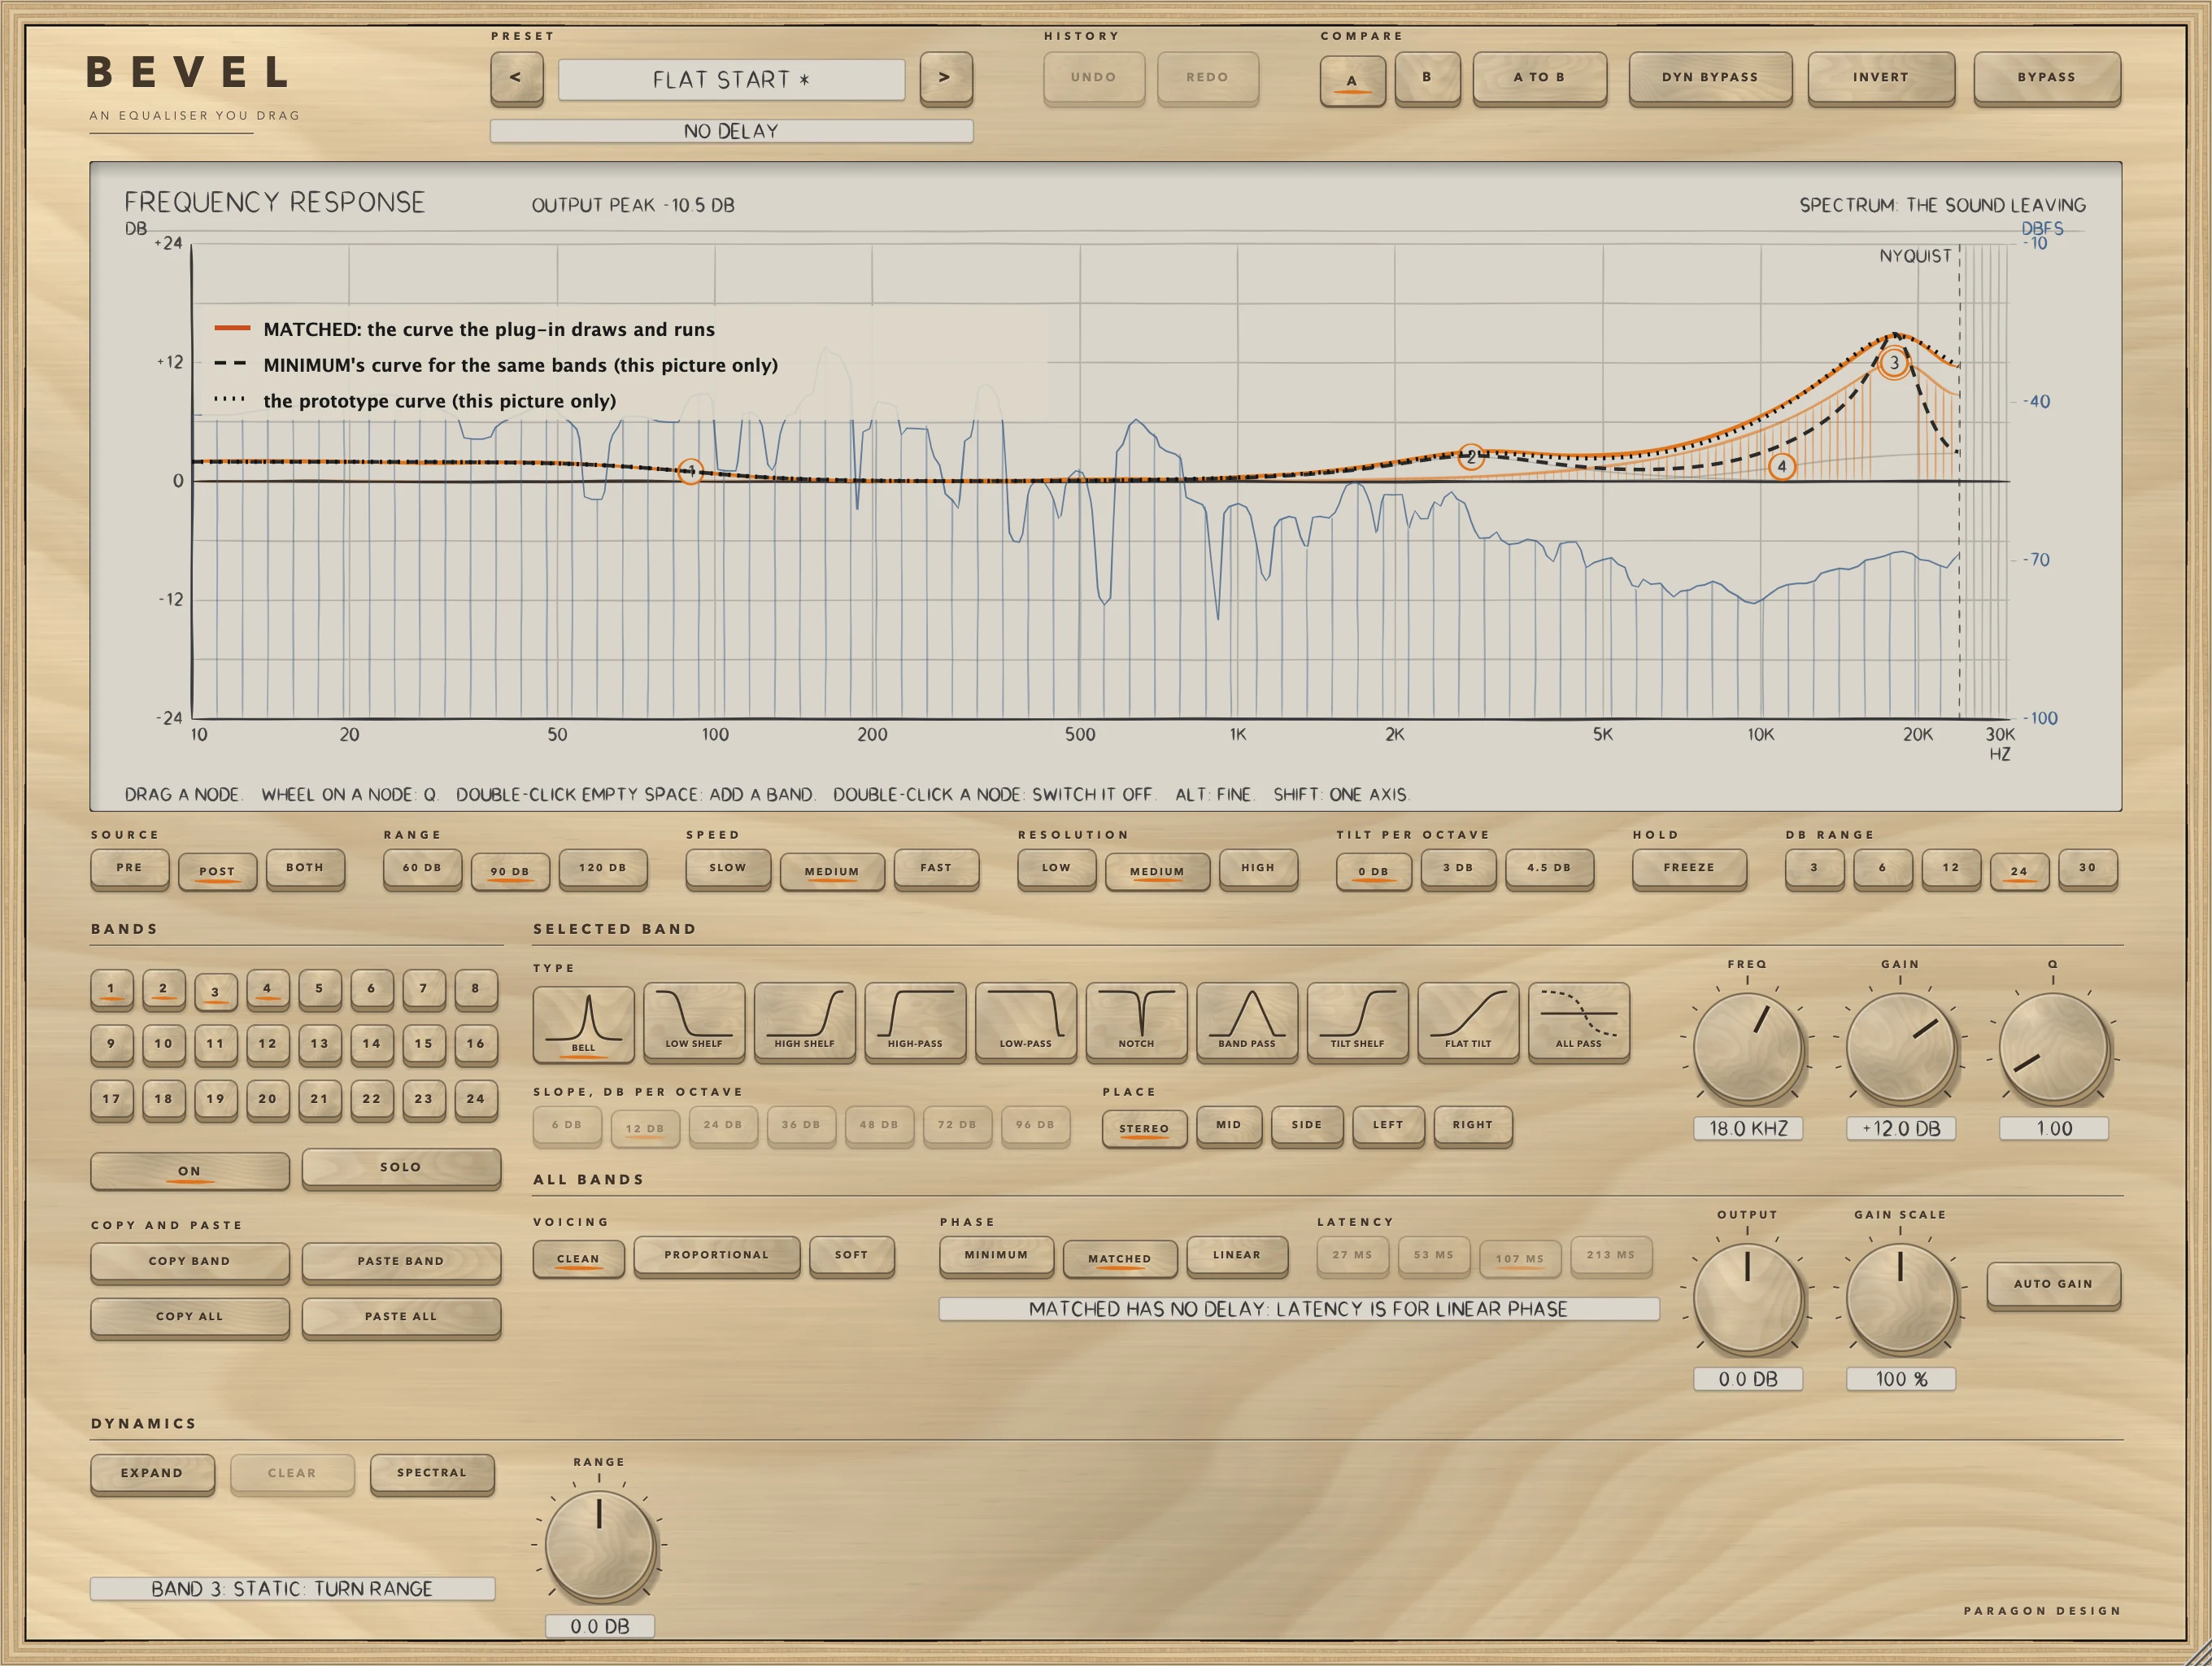
Where a digital bell cannot match an analogue one, BEVEL says so rather than hide it. At 44.1 kHz the curve of a +12 dB bell at 20 kHz departs from the analogue prototype's by up to 8.2 dB at its worst point in MINIMUM, and by up to 0.44 dB in MATCHED; at 192 kHz the figures are 0.95 and 0.24 dB. The display draws the curve the engine runs in the mode you chose, and nothing is corrected behind it.
- 0.014 dBThe farthest the engine's response lands from the design curve, over every shape at 44.1, 48, 96 and 192 kHz, from 20 Hz to 0.45 of the sample rate (limit 0.05 dB). The worst was a low-pass.
- 0.435 dBHow far a +12 dB bell at 20 kHz with Q 1 departs from the analogue prototype's curve at its worst point at 44.1 kHz in MATCHED (limit 0.5 dB), against 8.159 dB in MINIMUM. At 48, 96 and 192 kHz: 0.445, 0.484 and 0.239 dB in MATCHED, 6.226, 3.295 and 0.951 dB in MINIMUM.